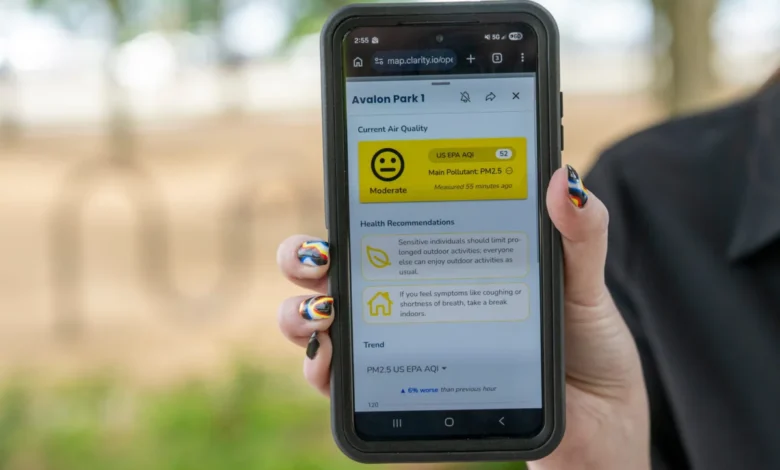
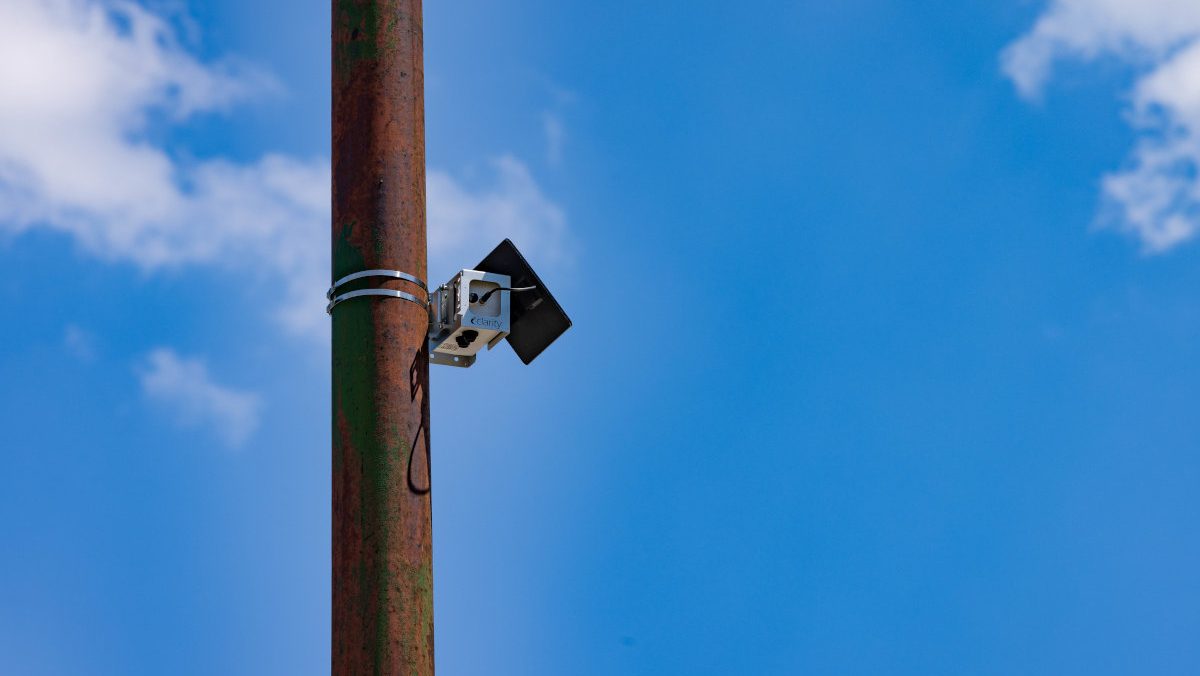
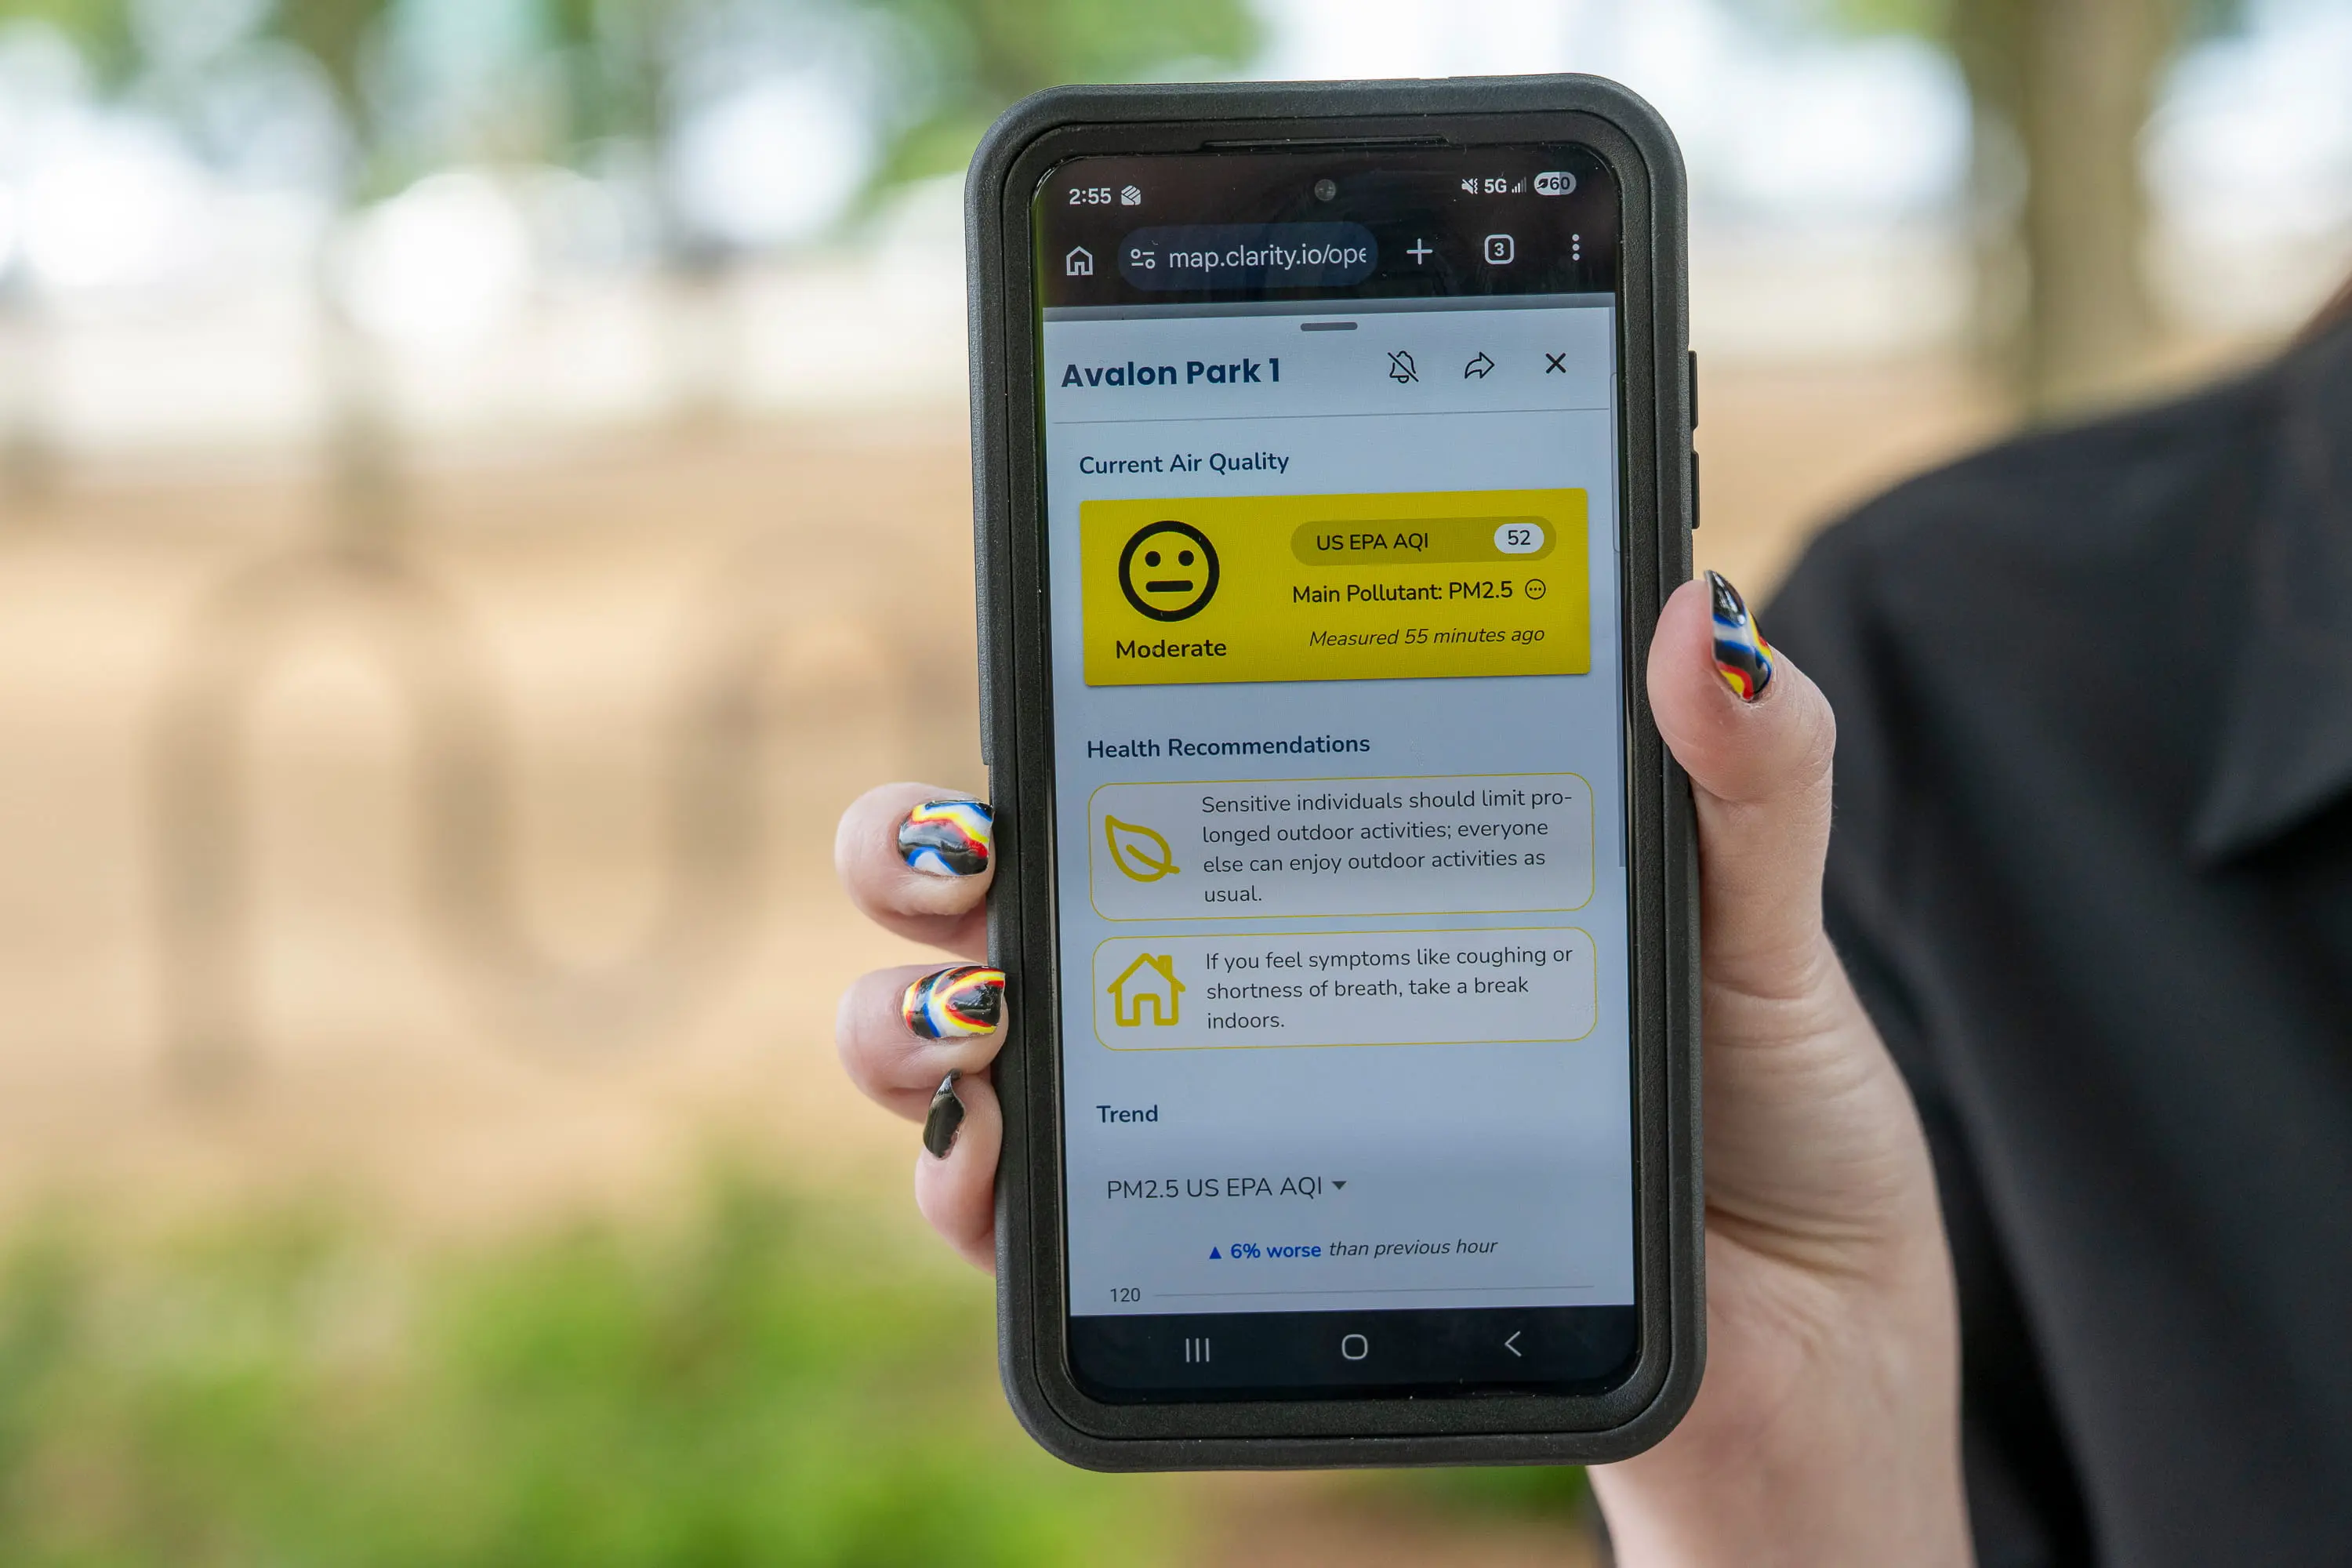
As the midday sun glints off the glass towers of Chicago’s Loop, Serap Erdal, a professor of environmental and occupational health sciences at the University of Illinois Chicago, pauses at a nondescript light pole in Grant Park. Her attention is not on the iconic skyline or the bustling commuters, but on a small, metallic silver box mounted just above head height. With a few taps on her smartphone, she accesses a live map of the city, revealing a network of data points that represent a revolutionary shift in how urban environments are monitored and managed.
This device is one of 277 solar-powered air quality monitors that now blanket the city, forming the most extensive community-based air monitoring network in the United States. Known as Open Air Chicago, the initiative represents a five-year, $4 million partnership between the City of Chicago and the University of Illinois Chicago (UIC). The project aims to provide residents with real-time, hyperlocal data on the air they breathe, while simultaneously offering policymakers a scientific foundation for future urban planning and public health interventions.
The Genesis of Open Air Chicago: From Conflict to Collaboration
The implementation of this massive monitoring network did not occur in a vacuum; it is the direct result of a protracted legal and social battle over environmental justice. The project’s origins can be traced back to 2020 and 2021, when the city faced intense criticism for its decision to permit the relocation of General Iron, a scrap-metal shredding operation, from the affluent, majority-white Lincoln Park neighborhood to the Southeast Side—a region predominantly inhabited by Black and Latino residents already burdened by a legacy of heavy industry.
In response to the relocation plan, local environmental activists and community organizations, including the Southeast Environmental Task Force, filed a federal civil rights complaint with the Department of Housing and Urban Development (HUD). The complainants argued that the city’s zoning and permitting practices were inherently discriminatory, effectively concentrating industrial pollution in low-income communities of color.
The ensuing legal struggle culminated in a landmark 2023 settlement between the city and community groups. A central pillar of this agreement was the establishment of a comprehensive, transparent air monitoring system. Oscar Sanchez, director of the Southeast Environmental Task Force, views the network as a vital tool for community empowerment. For decades, residents in industrial corridors have reported higher rates of respiratory illness, but they often lacked the granular, time-stamped data necessary to prove a direct link to local emissions. The Open Air Chicago network effectively ends what Sanchez describes as the "gaslighting" of these communities by providing undeniable evidence of their daily environmental reality.
Technical Specifications and the Power of Hyperlocal Data
The network’s 277 sensors are strategically distributed across every ward and community area in Chicago. While the distribution is citywide, there is a deliberate concentration of monitors in "overburdened" neighborhoods—areas where industrial facilities, freight hubs, and heavy truck traffic are most prevalent.
The sensors, while less expensive than the "gold standard" regulatory-grade monitors used by the Environmental Protection Agency (EPA), offer a distinct advantage: density. Traditional EPA stations are sparse and provide a regional overview of air quality. In contrast, the Open Air Chicago sensors are placed less than a mile apart, allowing for the identification of specific "hot spots" that a distant EPA station might miss.

Each monitor tracks two primary pollutants:
- Fine Particulate Matter (PM2.5): These microscopic particles, approximately 1/20th the width of a human hair, are particularly dangerous because they can bypass the body’s natural defenses, entering the lungs and even the bloodstream. PM2.5 is a byproduct of combustion, including vehicle exhaust and industrial processes.
- Nitrogen Dioxide (NO2): Primarily emitted from the burning of fuel in cars, trucks, and power plants, NO2 is a precursor to the formation of ground-level ozone and is strongly linked to the development of childhood asthma and other cardiovascular issues.
The network generates over 20,000 data points daily, creating a high-resolution map of the city’s atmospheric health. This volume of data allows researchers like Professor Erdal to observe how air quality fluctuates not just day-to-day, but hour-to-hour and block-to-block.
The Summer Challenge: Ozone, Smog, and the Climate Gap
As Chicago enters the peak of summer, the monitoring network faces its most critical test. While clear, breezy days often result in "green" readings—indicating safe air quality—the combination of high temperatures and stagnant air creates a volatile chemical environment.
Ground-level ozone, the primary component of smog, is not emitted directly into the air. Instead, it is created by chemical reactions between oxides of nitrogen (NOx) and volatile organic compounds (VOCs) in the presence of sunlight. As climate change leads to longer, more intense heatwaves, the conditions for ozone formation are becoming more frequent in the Midwest.
Furthermore, the region is increasingly susceptible to the effects of distant wildfires. In the summer of 2023, smoke from record-breaking Canadian wildfires descended upon Chicago, turning the sky a hazy orange and driving pollution levels to dangerous heights. A study published earlier this year indicated that these wildfire events raised ground-level ozone in Chicago by nearly 10% of the federal limit, with the South and West Sides bearing the brunt of the impact.
The "Climate Gap"—the phenomenon where marginalized communities suffer first and worst from the effects of climate change—is vividly illustrated by this air quality data. Residents in neighborhoods with less green space and more asphalt (the "urban heat island effect") experience higher local temperatures, which in turn accelerates the formation of ozone, compounding the existing burden of industrial pollution.
Bridging the Gap Between Satellites and the Surface
The Open Air Chicago project also serves a critical scientific purpose by validating data from other sources. While NASA satellites provide a global view of air pollution, they often struggle to distinguish between pollutants high in the atmosphere and those at the surface where people breathe.
Carl Malings, a researcher at Morgan State University and NASA’s Goddard Space Flight Center, notes that satellite data can sometimes be misleading. A smoke plume might appear dense from space, but it could be passing thousands of feet above the ground without impacting local health. By comparing satellite observations with the ground-level readings from Chicago’s 277 sensors, scientists can refine their models and provide more accurate health alerts to the public.

Institutional Reactions and Policy Implications
The City of Chicago’s Department of Public Health (CDPH) has integrated the Open Air Chicago data into its daily operations. Grace Adams, a project administrator at CDPH, emphasizes that the goal is transparency. The data is available to the public in real-time, allowing residents to make informed decisions about outdoor activities, such as whether it is safe for children with asthma to play outside on a particular afternoon.
Beyond immediate public health alerts, the data is expected to drive long-term policy shifts. The five-year record of air quality will serve as a baseline for:
- Zoning and Permitting: Officials will have the data necessary to deny permits to new industrial facilities in areas that are already experiencing "pollution saturation."
- Transportation Planning: The identification of NO2 hot spots can guide the city in rerouting heavy truck traffic or prioritizing the electrification of public transit in specific corridors.
- Urban Greening: Data showing high heat and ozone levels can help the city target tree-planting initiatives to provide cooling and natural air filtration.
Conclusion: A Blueprint for the Future
The Open Air Chicago network represents a significant shift in urban governance—one that prioritizes scientific data and environmental equity over traditional industrial expansion. By the time the current funding cycle ends in 2030, the city will possess a decade of hyperlocal data that could redefine the relationship between Chicago’s industrial heritage and its public health future.
For Serap Erdal and the community activists on the South and West Sides, the 277 silver boxes on light poles are more than just sensors; they are symbols of accountability. As Erdal looks at the green dot on her phone in Grant Park, she is mindful that the goal is to ensure that every neighborhood—regardless of zip code or demographics—can eventually see that same green light, even on the hottest, most industrial days of a Chicago summer. The project sets a precedent for cities worldwide, demonstrating that while the air may be invisible, the data used to protect it must be seen by everyone.


